Dashboard
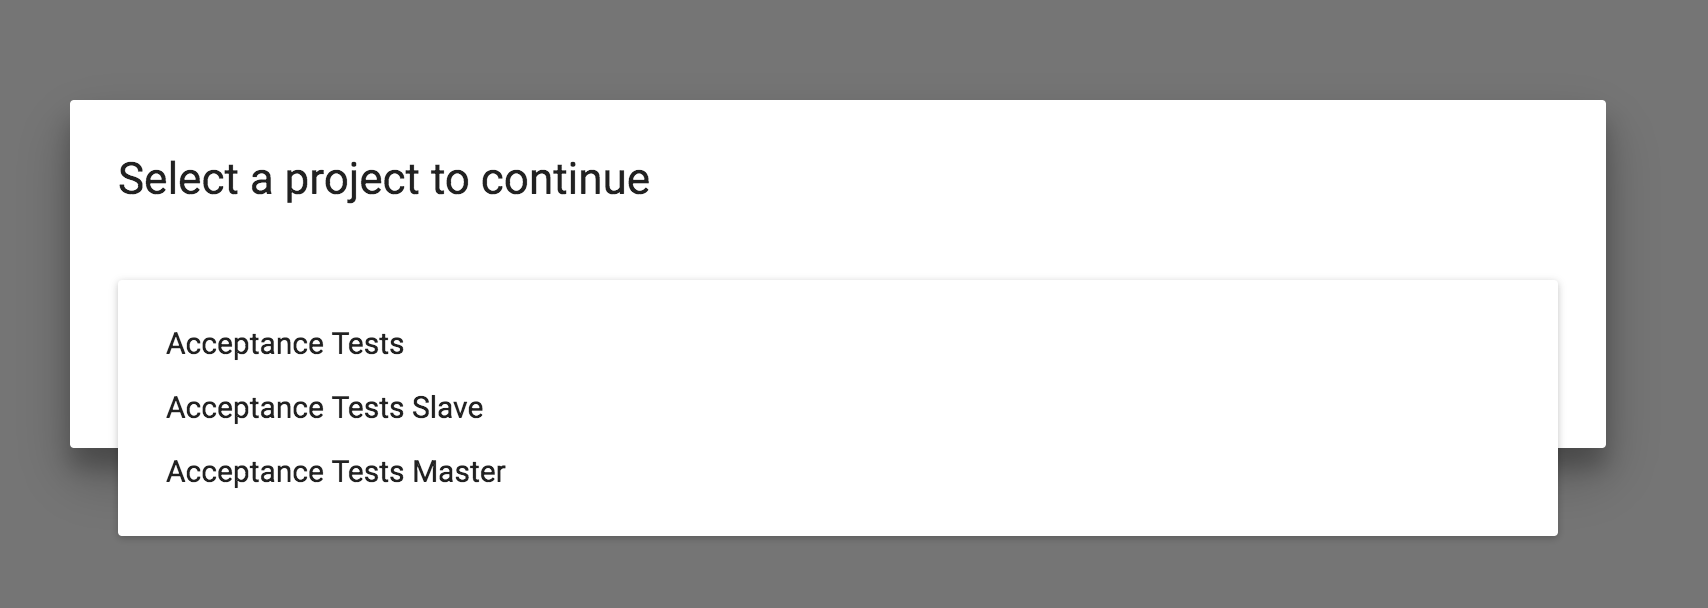
Navigate to the conQlude URL and select a project from the drop-down menu to launch the conQlude Dashboard. The project can also be changed by clicking on the project name listed to the right of the username.
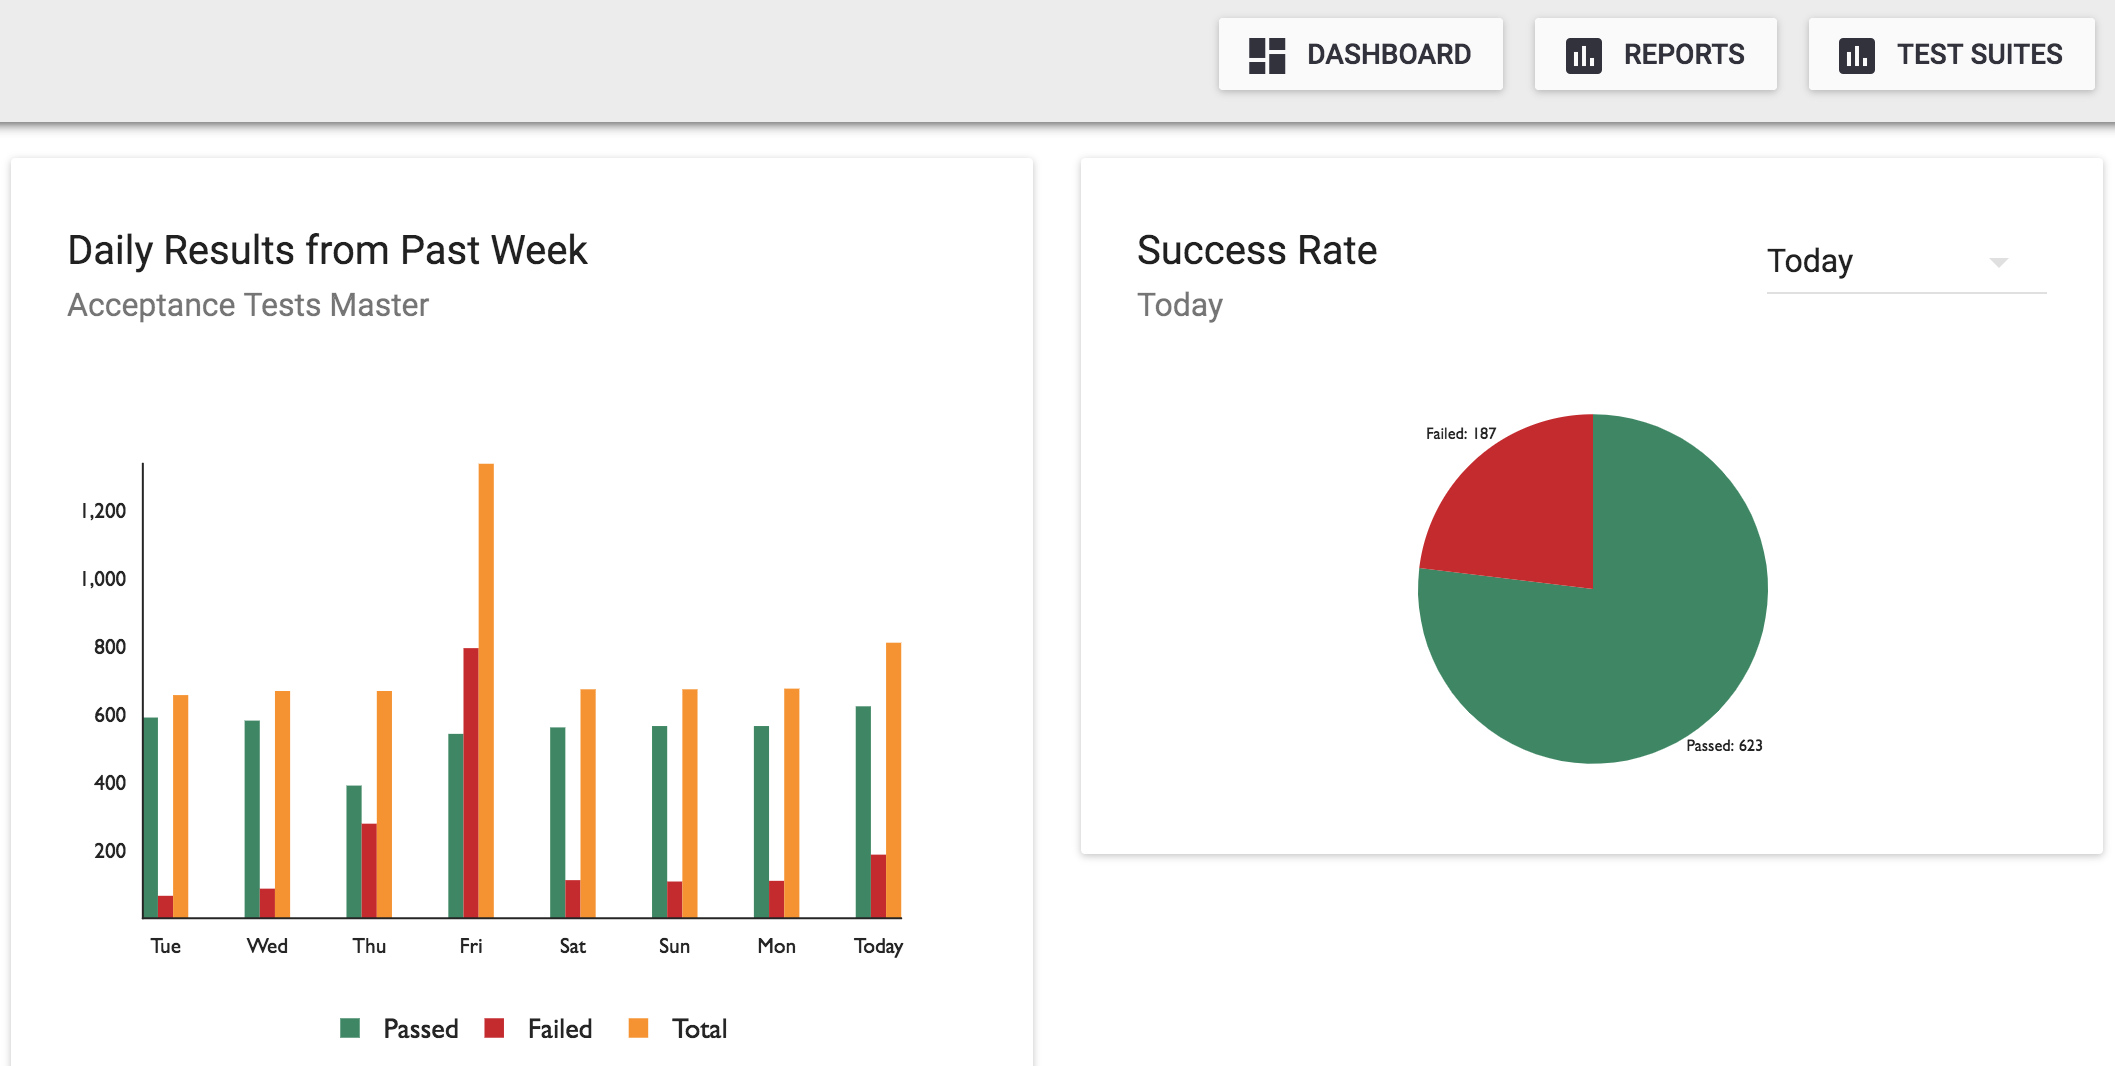
After launching conQlude, the Dashboard view displays charts for the selected project. These provide an overview of test suite execution metrics. The Dashboard can also be accessed from other tabs by clicking on the Dashboard button at the top of the page.
-
A Daily Results bar chart shows test suite execution results as
Passed,Failedand the Total number of executions.- To inspect a bar's value, hover the mouse over it. A box displaying the amount will appear.
-
A pie chart visualizes the proportion of
passedtofailedtest suite executions within a given timeframe. The following may be selected from the drop-down menu:today,last week,last monthorall.
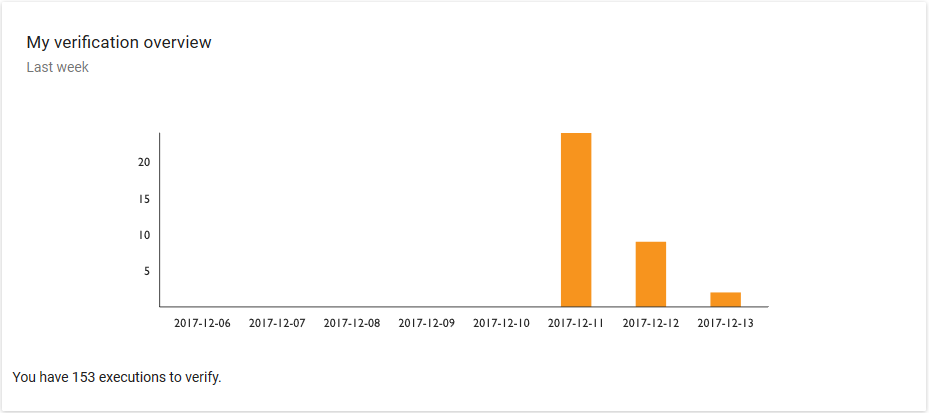
If conQlude the selected project requires executed test suites to be verified, the conQlude Dashboard will display a chart showing the number of unverified executions: