Chart Plotter Built-ins
Chart Plotter Built-ins return a new chart plotter object, which enables retrieving Data Sequence Events and Time Sequence Events data from the execution context objects. Chart Plotter Built-ins then create graphical representations of these data.|
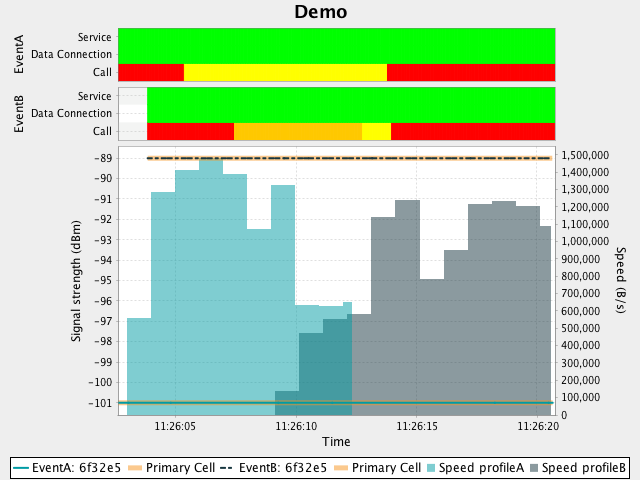
Legend
| Color | Service State | Data Connection State | Call State |
|---|---|---|---|
| Red | Power Off | Suspended | Idle |
| Orange | Out Of Service | Disconnected | Ringing |
| Yellow | Emergency Only | Connecting | Off-hook |
| Green | In Service | Connected | - |
The chart above named Demo highlights the primary cell's signal strength in orange. Signal strength is displayed on the left y-axis in decibels per minutes, and speed is displayed on the right y-axis in bytes per second. The x-axis shows the time in 24-hour format.
Create the Chart 
The create() function returns a new Chart Plotter instance. Additional functions are available to add data, a title and to plot the data.
Syntax
1 | <result ChartPlotter> := Chart.create() |
Returns
The new Chart Plotter instance.
Example
1 | chart := Chart.create() |
Add Speed Profile 
The addSpeedProfile function adds speed profile measurement data to the chart.
Syntax
1 2 | <chartPlotter ChartPlotter>.addSpeedProfile(<name String>, <dataSequence DataSequence>) |
Parameters
-
chartPlotter - The Chart Plotter instance
-
name - An assigned name that will be shown in the report
-
dataSequence - The speed profile data being added to the chart
- This is generated by the speed profile measurement
Example
1 2 | chart.addSpeedProfile("Speed profileA", getExecutionContextObject("D1")["result"]) chart.addSpeedProfile("Speed profileB", getExecutionContextObject("D2")["result"]) |
Add Event Sequence 
The addEventSequence function adds event sequence data to the chart.
Syntax
1 2 | <chartPlotter ChartPlotter>.addEventSequence(<name String>, <eventSequence EventSequence>) |
Parameters
-
chartPlotter - The Chart Plotter instance
-
name - An assigned name that will be shown in the report
-
eventSequence - The event sequence data being added to the chart
Example
1 2 | chart.addEventSequence("EventA", getExecutionContextObject("timeSeqA")) chart.addEventSequence("EventB", getExecutionContextObject("timeSeqB")) |
Plot the Chart 
The plot function plots the chart.
Syntax
1 | <chartPlotter ChartPlotter>.plot(<name String>) |
Parameters
-
chartPlotter - The Chart Plotter instance
-
name - An assigned name that will be shown in the report
Example
1 2 3 4 5 6 7 8 9 | stepdef "plot chart" chart := Chart.create() chart.setTitle("Demo") chart.addEventSequence("EventA", getExecutionContextObject("timeSeqA")) chart.addEventSequence("EventB", getExecutionContextObject("timeSeqB")) chart.addSpeedProfile("Speed profileA", getExecutionContextObject("D1")["result"]) chart.addSpeedProfile("Speed profileB", getExecutionContextObject("D2")["result"]) chart.plot("Test") end |
Note: A download's execution context object holds the download parameters. The result is stored in the additional field with name "result".
Example Feature File 
Feature File Example
1 2 3 4 5 6 7 8 9 10 11 12 13 14 15 16 17 | Given an Android phone as A And an Android phone as B Then start recording a time sequence on phone A as timeSeqA Then A starts a download from "http://testdata.qvie.qitasc.com/data/200MB" as D1: * it stops after 10MB Then start recording a time sequence on phone B as timeSeqB Then B starts a download from "http://testdata.qvie.qitasc.com/data/200MB" as D2: * it stops after 10MB Then A starts a call to B as MYCALL: * detect incoming call within 10 seconds * call duration is 1 second * caller ends the call Then within 60 seconds, B expects download D2 to finish Then within 60 seconds, A expects download D1 to finish Then stop recording the time sequence timeSeqA Then stop recording the time sequence timeSeqB And plot chart |