Test Run Reports
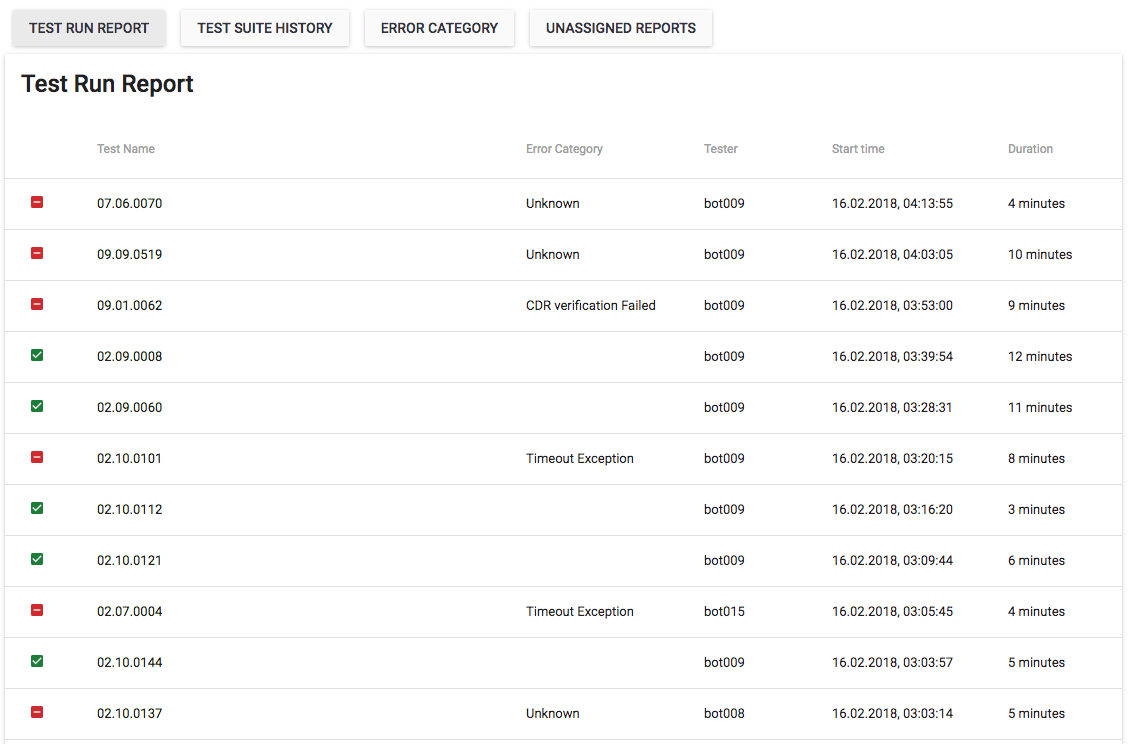
From the Dashboard, click on the Reports button. A view showing a list of test run reports will appear. This list represents all test case execution reports executed by all testers for the selected project.
-
The column on the far left displays test execution status:
 -
- Passed -
- Failed
-
The Test Name column lists the scenario name assigned in intaQt.
- A
 next to the test name indicates a bug defined by an administrator is present.
- A
-
The error category specifies the error that occurred in a
failedtest case. -
The Tester column shows which user executed the test run.
-
Start Time indicates the time the test run started at.
-
Duration specifies the test run's length.
Filter Test Run Reports
Use the drop-down menus on the right-hand side of the Test Run Report to filter reports according to the project's criteria.
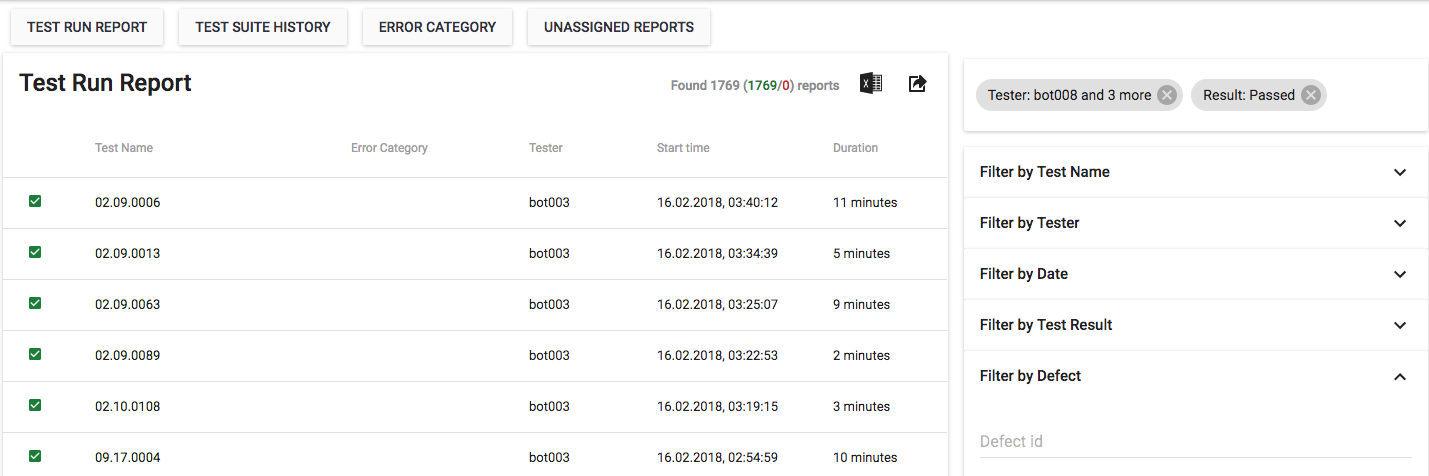
Additional fields may be set by an Administrator
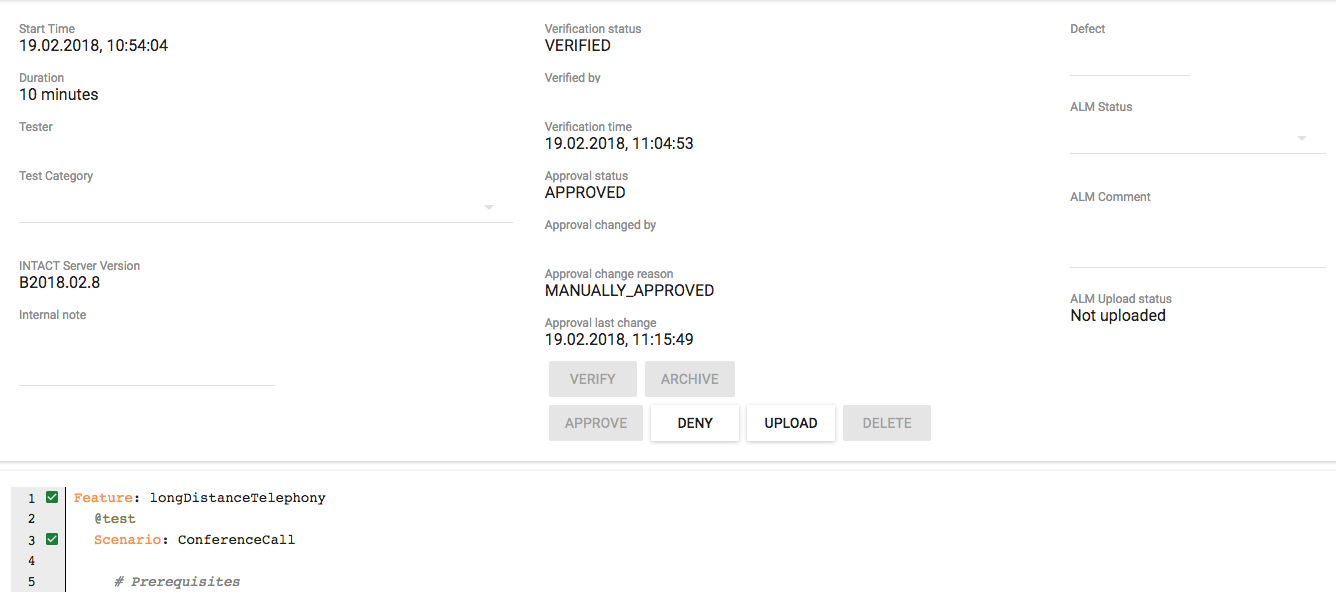
Select and View Test Run Report
Click on a test name from the Reports -> Test Run Report view to see the report's detail page. The top portion of the report contains project-related fields populated with information about the selected test run. The report's header shows the test execution status, the name and may contain different icons next to the name.
Test Case Icons 
Three types of icons are used:
-
Warning icons - Indicate test management characteristics (for example, bugs, approval states).
-
Attachment icons - Indicate attachment types provide attachment preview and downloading.
-
Event icons - Indicate events, such as connection states.
Additionally, clicking the  at the top of a report will list test suite executions with the same test suite id that have been executed within the project.
Warning Icons
Several icons may appear next to a test case name, like the example below:

The following warning icons may appear next to the test suite name:
-
 - The test suite execution has been verified.
 -
 - The test suite execution has been approved.
 -
 - The test suite execution has been uploaded to an external project management system.
 -
 - The test suite execution is missing a test category.
 -
 - Scheduled for deletion. Reports may be deleted by a test manager one of the following ways:
- Automatic - When a test execution is uploaded to an external test management system, previous executions of that test suite, which have not been uploaded or approved, are deleted.
- Manual - By clicking delete button
 in the execution details page.
-
 - ALM Status changed after upload to HPQC.
 -
 - YouTrack ticket missing (only appears if project is integrated with YouTrack).
Attachment Icons 
Attachment icons indicate files attached the test suite execution. Clicking on an icon displays its content in a popup. Icons are displayed in the feature file details next to the steps for which there are attachments. Alternately, click the  at the top of a report to see a list of all attachments from its execution.
The following attachment icons may appear next to steps in the Feature File details:
-
</> - an
.xmlfile. -
HTML - an
.htmlfile. -
JSON - A
.jsonfile. -
PCAP - A
.pcapfile. -
PNG - A
.pngfile. -
TXT - a
.txtfile. -
 - A plaintext file.
 -
 - An image file.
 -
 - An audio recording file.
 -
 - A video file.
 -
 - Other file type.
Event Icons 
Event icons indicate when events such as changes in phone states or SMS transfers occurred. Clicking on the icon shows a popup with the event details.
The following event icons may appear next to steps in the Feature File details:
-
 - A change in phone state. May be one of:
 PhoneConnected,PhoneDisonnectedorCallInitiated. -
 -
- SmsReceivedorSmsSent. -
 -
- SmsReceivedorSmsSent. -
 - Other event.
Feature File Details 
The middle of the portion of the test contains a copy of the executed Feature File and displays each steps's status:
-
Green - Passed
-
Yellow - Skipped
- These are steps that are unexecuted following a
failedstep
- These are steps that are unexecuted following a
-
Red - Failed
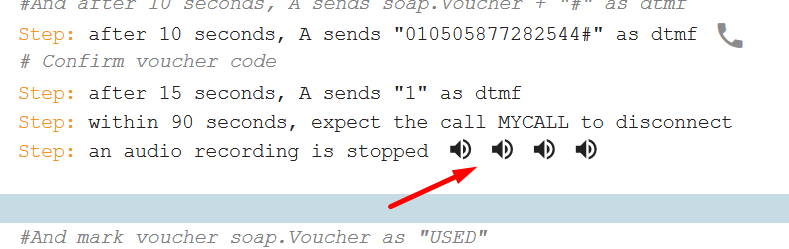
Some steps contain additional info indicated by attachment icons or event icons. Clicking on these icons will generate a box containing additional details about the step's content. In some cases, an option to download, preview or remove the additional details is included.
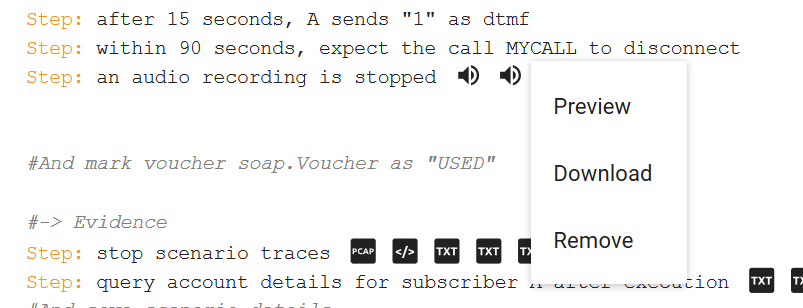
Example
Upon clicking the icon, a drop-down menu will appear:
Test Case Logs
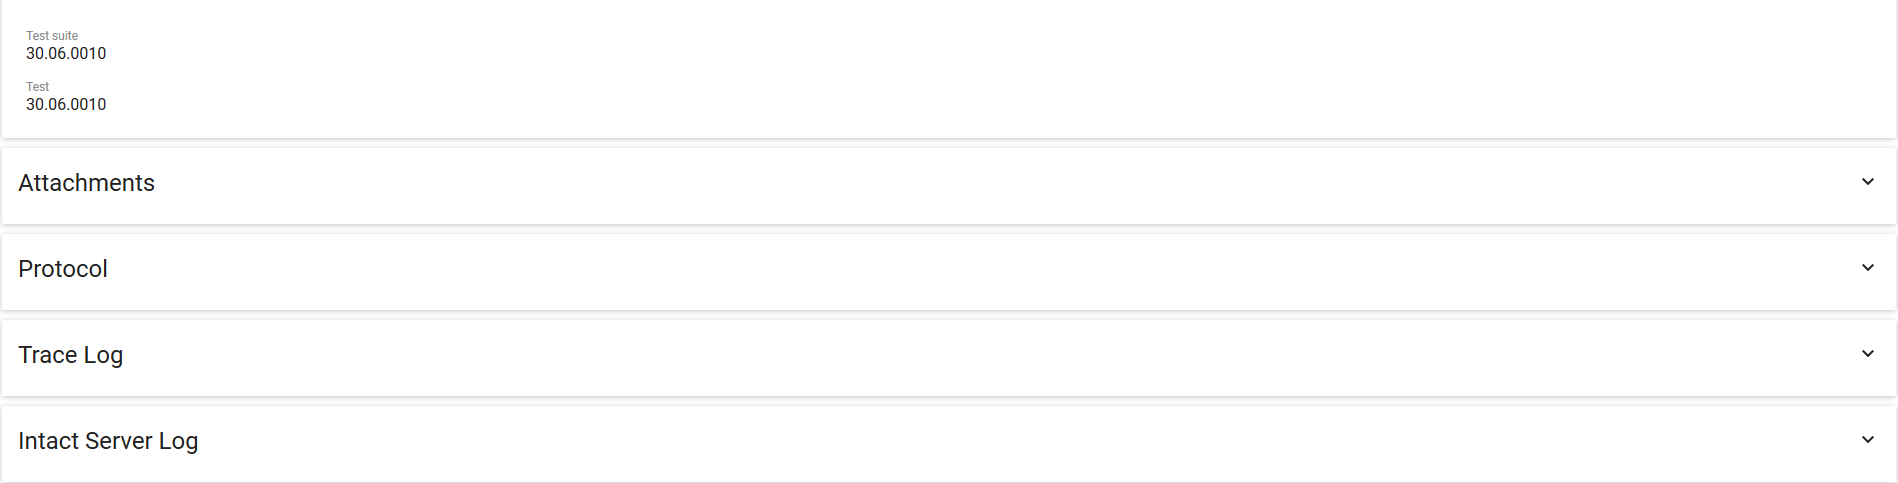
Beneath the feature file, the following trace tabs are available:
-
The test run's Protocol log.
-
The test run's Trace log.
-
The test run's intaQt log.
Clicking on the ˇ symbol next to a log will expand it.
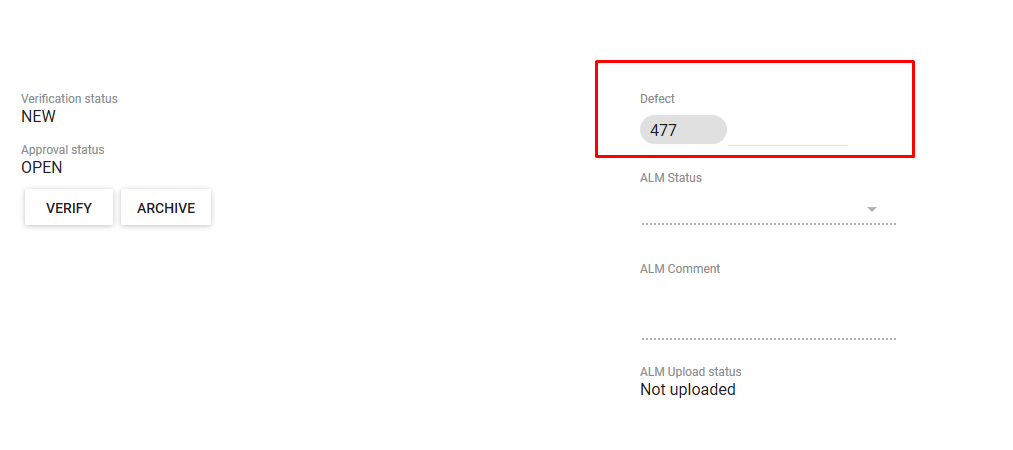
Enter Defect ID
To apply an existing defect ID to a test run report, click on the Defect box and enter the ID:
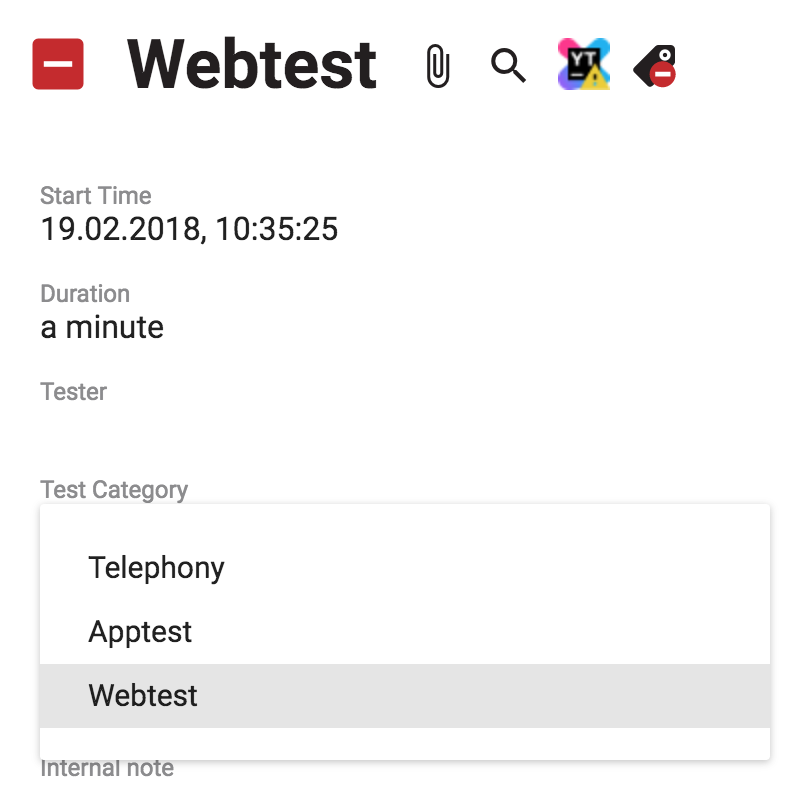
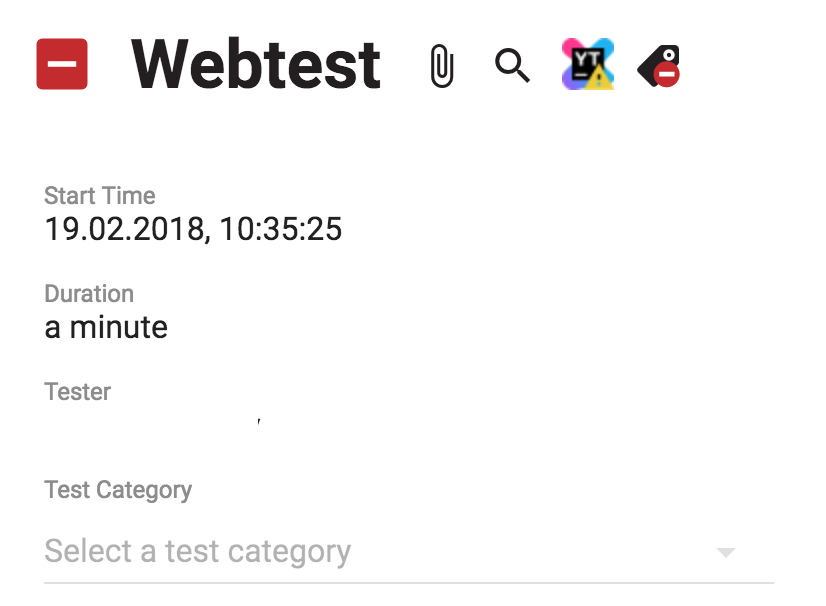
Add Missing Test Category
If a user omits a test category at the time of execution, a will appear next to the test name. The category may be manually added within the test run report.
Click on the report with the missing tag. A Select a test category drop-down menu will appear under the Test Category field:
Select the correct category from the drop-down menu: